Why are KPIs (Key Performance Indicators) Important for Measuring Your Loyalty Program’s Success
KPIs are important for evaluating the success of a loyalty program because they provide insights into how well your business aligns with customer expectations, whether it’s customer service, products, and so on.
Each KPI offers a different perspective on your business’s performance, helping you identify and address specific issues.
For instance, a low benefit redemption ratio may indicate that your rewards aren’t appealing to your target demographic or that the redemption process is too troublesome and not user-friendly.
These metrics also reflect your product’s performance; a declining customer lifetime value might suggest that your product offerings need improvement, potentially leading customers to spend less or consider alternatives.
Ultimately, analyzing data from your loyalty program can offer valuable insights into the behavior of your target customers, even those who aren’t actively participating in the program.
The 10 Most Important Loyalty Program KPIs to Take Note Of
Customer Churn Rate
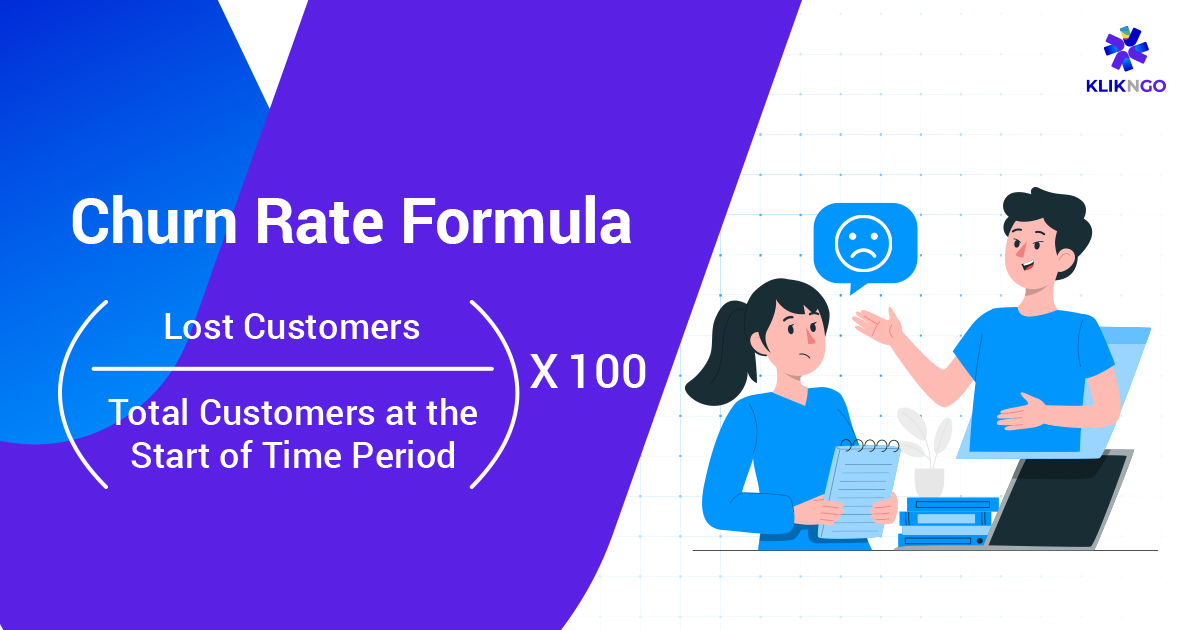
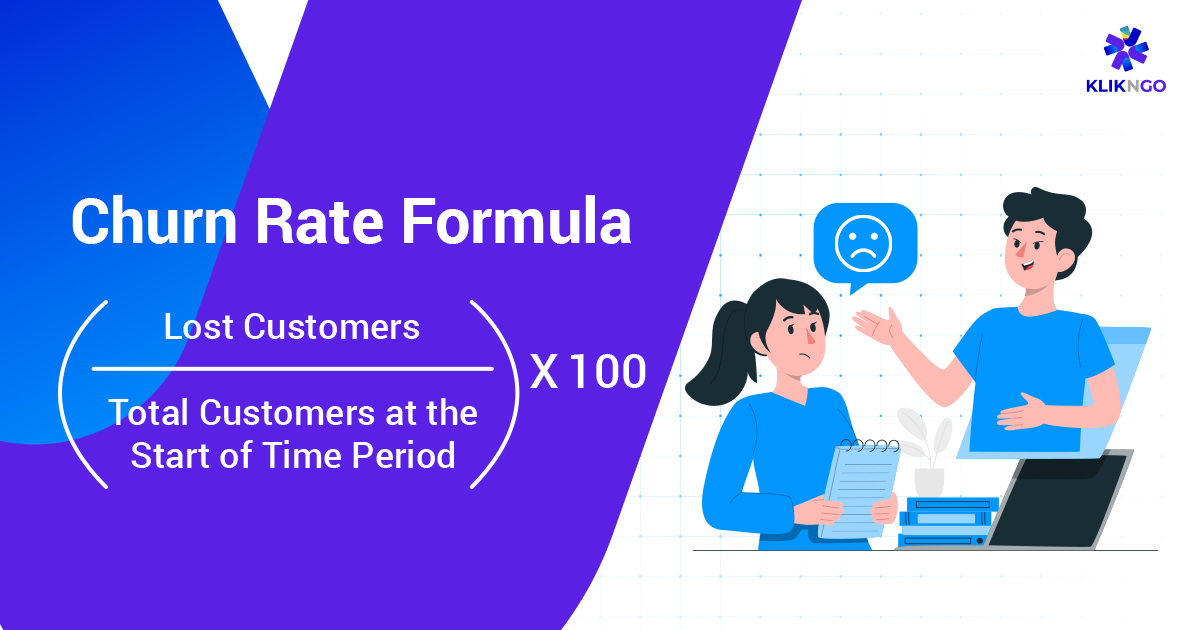
The first KPI we’re looking at is the customer churn rate, which measures the rate at which customers become inactive or stop engaging with your business. A high churn rate could indicate issues with customer satisfaction, or loyalty to a certain extent. You have to remember that businesses usually calculate customer churn rates over time.
For example, if 1,000 out of 20,000 customers stop engaging with your business (becoming dormant) over the timespan of a year; your customer churn rate would be 5% for that year.
To reduce customer churn, you can try setting up retargeting campaigns. Start by segmenting your inactive customers and using email or SMS marketing to encourage them to reconnect with your brand.
Personalizing these campaigns is important for maximizing conversion rates. Review your CRM for specific customer tags or patterns to tailor your outreach effectively.
Customer Retention Rate
Customer retention rate is the exact inverse of customer churn rate and measures how many customers you keep over a specific period of time. Essentially, they are 2 sides of the same coin.
You want this figure to be as high as possible, meaning you retain as many customers as possible and foster as much loyalty as possible.
Going back to the example mentioned earlier, if your churn rate is 5% ( 1,000 out of 20,000 customers stop engaging with your business).
Your customer retention rate would be 95%, meaning you retain 19,000 out of 20,000 customers.
For context, depending on your industry, a typical customer retention rate of 35 to 75% is usually good, and anything below or above that is two ends of the extreme.
Average Customer Engagement Time
Next, let’s talk about the average customer engagement rate. This metric measures how long customers interact with your brand across various touchpoints, such as your website, e-commerce platform, booking page, loyalty app, and even during events.
Unlike many other metrics, longer customer engagement isn’t always better. If engagement times are too short, it might signal issues with your product or pricing, implying customers find your offerings unappealing or too expensive.
On the other hand, excessively long engagement times could indicate problems with your purchasing or redemption processes, causing delays in customer conversions.
For service providers, a typical average engagement time on a booking page is around 1 minute 30 seconds, whereas for e-commerce pages, it’s typically about a minute.
While aiming for an average engagement time of around a minute is generally good practice, optimal engagement times can vary significantly by industry and location.
We recommend researching the ideal engagement time for your specific industry and analyzing your own data to find the optimal balance.
Service or Product Conversion Rate
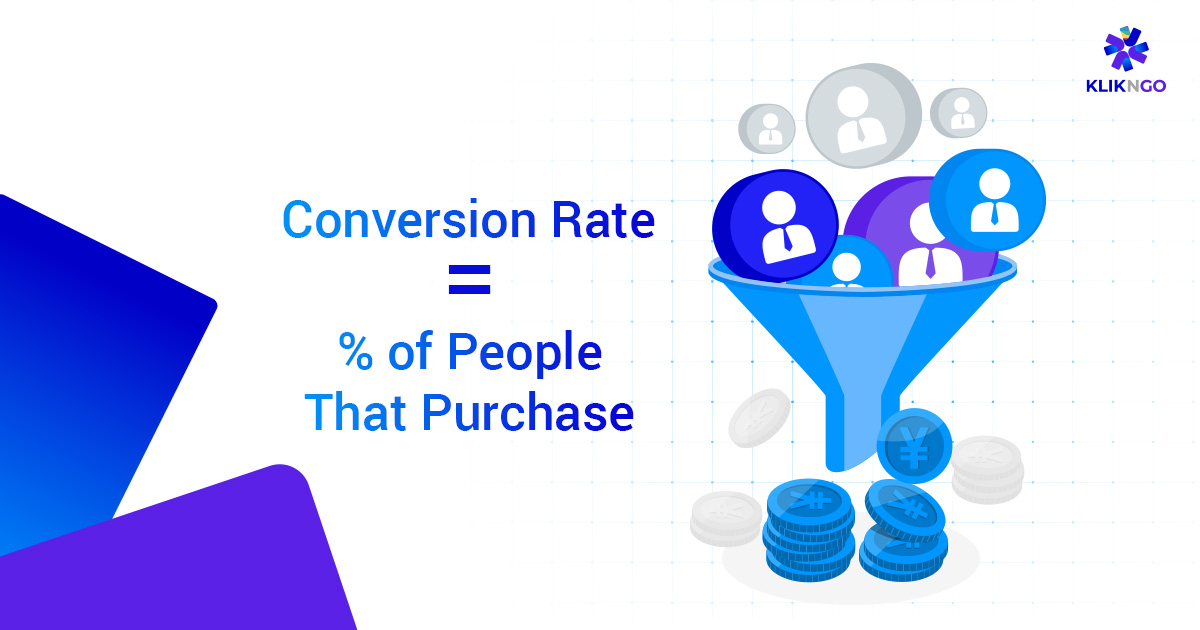
Next, let’s discuss the product conversion rate. This metric essentially tracks how many people make a purchase or book a service after interacting with your website, or online store.
It’s important because all the effort you put into your e-commerce site and tracking tools should ideally translate into actual conversions.
Conversion rate is almost always related to your products and offerings, think to yourself:
- Does your product have a unique selling point that sets it apart?
- Is the price aligned with what customers perceive as its value?
- Are there features or benefits your competitors offer that you don’t?
Besides product-related factors, other issues could impact your conversion rate. For instance, lacking social proof or trust signals can deter potential buyers. Similarly, not offering value-added services like free shipping or consultations might affect conversions.
Things like a lack of trust signals can be managed with a better UI/UX experience, and an active social media profile, but product and value-added service-related issues might need a lot more help, as it can involve many departments, from operations to product management, and marketing.
Try to also look at data from different touchpoints (ideally from your CRM) to see what to improve when it comes to conversion rates.
Customer Lifetime Value
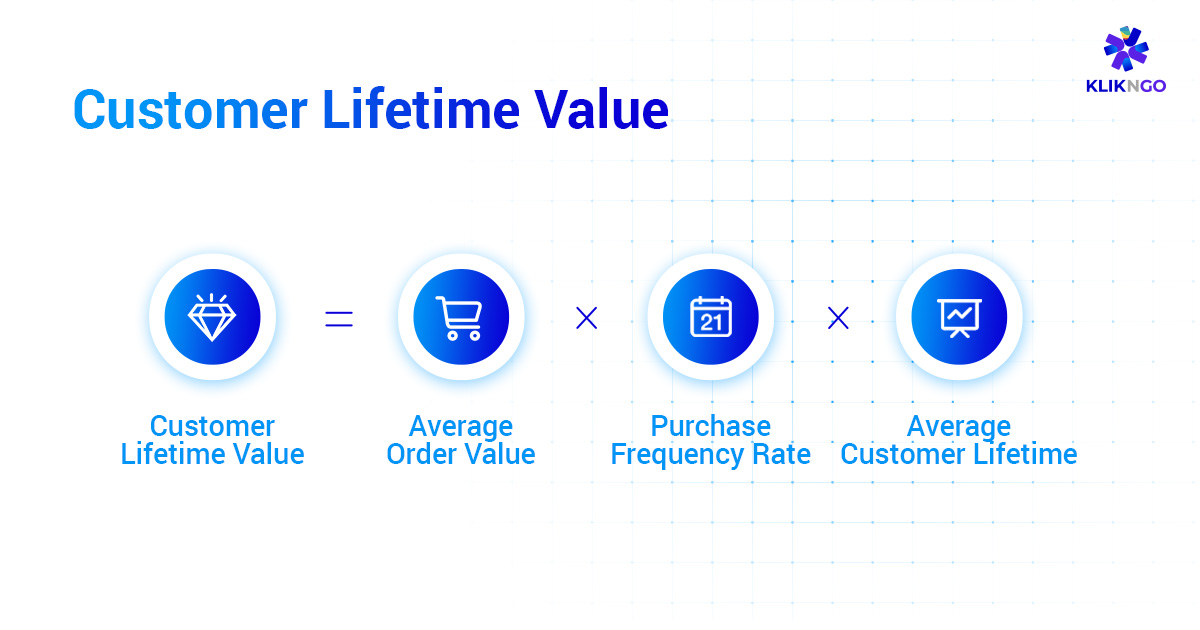
Customer Lifetime Value (CLV), also known as CLV, is one of the most important loyalty program KPIs because it shows how much revenue or profit a customer is expected to generate throughout their entire relationship with your business.
CLV is typically calculated using average figures but can also be personalized for specific individuals if your CRM allows for that level of detail.
A higher CLV generally indicates greater loyalty, suggesting that these customers likely spend more and engage more frequently with your business, though this can vary depending on circumstances.
To leverage CLV effectively, you can try out segmenting customers with higher CLV and tailoring rewards specifically for them.
This approach can deepen loyalty, increase revenue from this group of customers, foster positive word-of-mouth, and enhance your net promoter score (which we’ll discuss later).
Benefit Redemption Ratio
Next, let’s talk about the Benefit Redemption Ratio, which measures the percentage of benefits, such as vouchers and points, that loyalty program members actually redeem.
This ratio indicates how appealing and practical your loyalty program benefits are for customers. It’s also a crucial metric for evaluating the effectiveness of your loyalty marketing campaigns, particularly those involving vouchers.
For instance, if 2,000 out of 10,000 vouchers issued are redeemed, the redemption ratio would be 20%, which in this example is not particularly high.
Ideally, you’d want your benefit redemption ratio to exceed 50%.
Many businesses focus on customers earning points but overlook the importance of the redemption process.
However, for a loyalty program to be truly effective, members need to both earn and redeem their rewards. Completing this cycle can better foster long-term loyalty and strengthen the relationship between your business and its customers.
Average Order Value
Another important metric to consider is the customer’s average order value. This number gives insights into customer spending habits and how well your upselling and cross-selling strategies are performing.
It’s important to take the average value because there might be a big variance. For example, some customers might have a very high basket value, but they only bought from your business once, which might indicate a problem with your product or that the customer is unhappy with their purchase.
There are several effective methods to increase average order value, and one approach we’ve found successful is gamification.
Take Omusubi, a prominent Japanese food chain in Hong Kong, as an example. They wanted to boost their average basket value. Partnering with KlikNGo, we developed a strategy that included a new app and loyalty program with gamified features.
Customers earned rewards by inviting friends and family to dine together, and we set challenges like consuming 20 sushi dishes weekly to unlock special promotions.
As a result, we’ve managed to help Omusubi increase their average basket value up to 125% while helping them gain over 40,000 new members per month. Our innovative approach was recognized with the 2023 Marketing Interactive Digiz Award!
Voucher-Driven Profit
Voucher-driven profit calculates the profit generated from sales influenced by voucher or point use. This KPI is important for assessing the effectiveness of those vouchers that members redeem through earning points.
For example, if a voucher campaign results in $100,000 in sales with a profit margin of 30%, your voucher-driven profit would be $30,000. This metric helps you assess whether voucher redemptions are profitable and justify their continuation.
If your vouchers aren’t profitable for your business, it would be better to swap them for other rewards for your customers and members to redeem.
Benefit redemption ratio and voucher-driven profit work hand-in-hand to gauge the effectiveness of vouchers and rewards.
Membership Growth Rate
The Membership Growth Ratio measures how quickly your loyalty program’s member base grows over a specific period. It shows how attractive your loyalty program is to potential members.
Like other key performance indicators (KPIs), the membership growth rate is expressed as a percentage.
For example, if your loyalty program grows from 10,000 to 12,000 members in 6 months, your membership growth rate for that period is 20%. If this growth rate remains steady, it could project to 40% annually.
Monitoring the membership growth rate is crucial because it helps ensure that customers at the top and middle of the sales funnel (those who may be new or less engaged) become loyal customers who complete the full customer journey, promoting lasting loyalty.
Net Promoter Score (NPS)
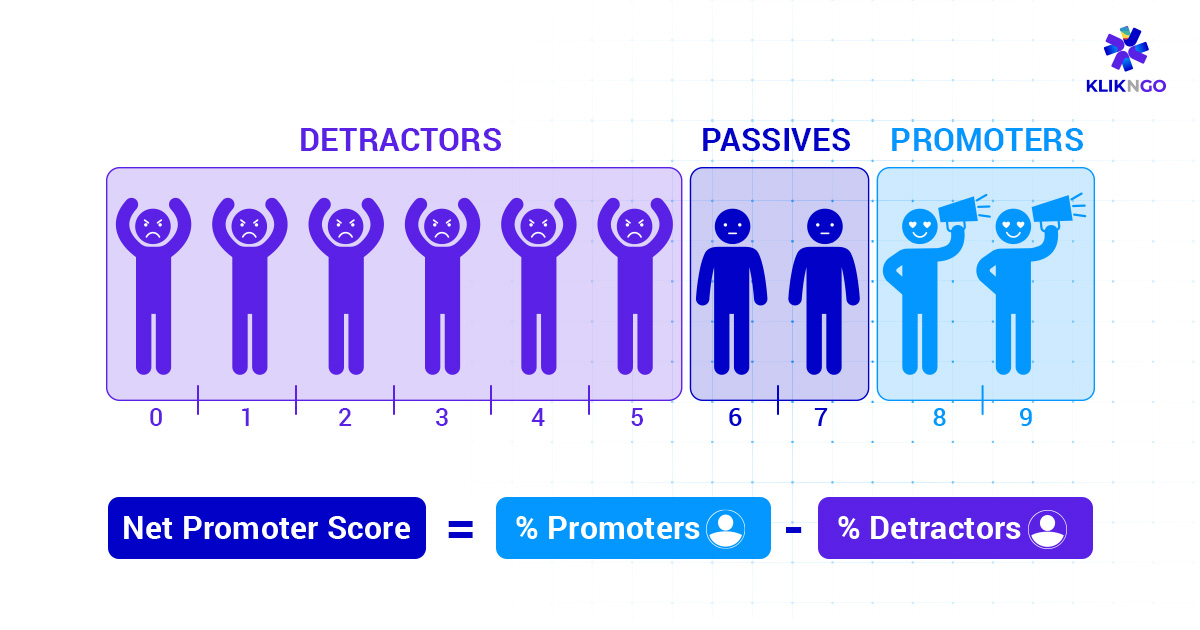
Net Promoter Score (NPS) measures how likely your members are to recommend your business or loyalty program to their friends and families. This score is a spectrum of 0 to 10 and can be broken down into 3 categories, which are:
- Promoters (scored 8-10): Promoters are the customers who are typically the most loyal and the most satisfied – which will be highly likely to recommend your business.
- Passives (scored 5 to 7): Passives are usually customers that have no opinion, and are less likely to promote your business. These are usually customers who are newer or think that your offerings and business don’t particularly stand out.
- Detractors (scored 0 to 6): Detractors are members or customers who might have had a bad experience and might actively deter their friends and family from engaging with your business.
Let’s say you surveyed 100 customers and asked them the NPS question: “On a scale of 0-10, how likely are you to recommend our company to a friend or colleague?“
Based on their responses, you categorize them as follows:
- Promoters (score 9-10): 60 customers
- Passives (score 6-8): 20 customers
- Detractors (score 0-5): 20 customers
Once you’ve converted these into percentages, you can use the following formula to calculate your Net Promoter Score:
NPS = %Promoters – %Detractors
If you apply the figures from the example above, the NPS = 60% – 20% = 40. This is scored between a spectrum from -100 to +100 – with anything above 0 being ideal.
What Return on Investment (ROI) Can You Expect When Improving These KPIs?
Enhancing your loyalty program’s key performance indicators (KPIs) can lead to significant returns on investment (ROI) for your business and loyalty program.
For instance, boosting customer retention rates not only keeps more customers coming back but also builds stronger, lasting connections that increase overall customer value over time.
Also, improving engagement times and product conversion rates makes sure that every customer interaction counts, driving revenue growth effectively.
Managing benefit redemption ratios and voucher-driven profits effectively ensure that your loyalty rewards are not just rewarding for customers but also profitable, enhancing customer satisfaction and loyalty.
Monitoring membership growth rates signals how appealing your program is to new members, expanding your customer base and potential revenues.
Lastly, improving Net Promoter Scores (NPS) indicates higher customer satisfaction and advocacy, which in turn can reduce marketing costs and attract more loyal customers organically.
If you’re interested in having a fully-fledged loyalty program that can help you automatically enhance these KPIs, why not check out our loyalty program product page for more information?
