
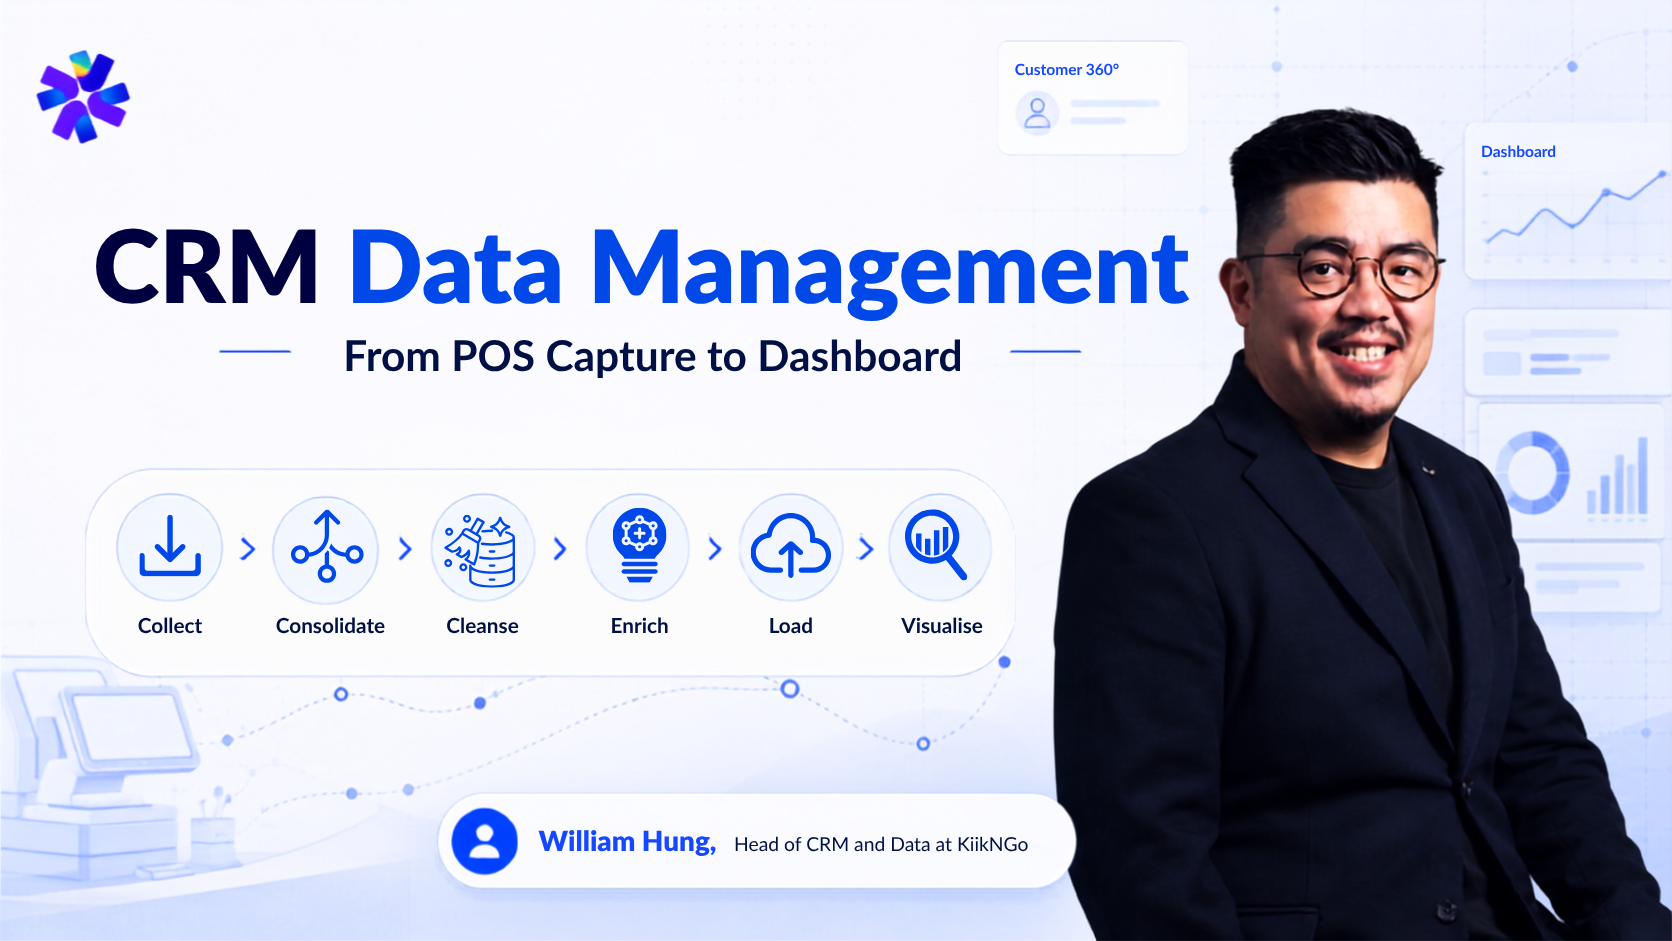


William Hung, Head of CRM and Data at KlikNGo, on the six stages a customer record passes through between capture and the dashboard, and how each stage shapes what the data can reliably tell you.
CRM data management is the set of rules governing a customer record between the moment it is created and the moment somebody acts on it. It covers six stages: collect, consolidate, cleanse, enrich, load and visualise.
That record can begin at a till, an app, a booking, a profile update, a service conversation or a campaign response. Most of what limits a loyalty program is decided in the first two stages, and by the time a record reaches a dashboard, the questions it can answer have already been decided.
This article covers the six stages. The next looks at what happens after the reporting is accurate, when customer data analytics and business intelligence have to turn insight into a business decision.
Key Takeaways
- Capture and consolidation set the ceiling. No later stage recovers what an earlier one discarded.
- Poor preprocessing removes useful detail while trying to remove bad data. Returns, split test cells and product detail are three examples.
- A pipeline moves data and a warehouse stores it. Buying one and expecting the other is a common and expensive substitution.
- Segmentation methods need different history and different detail, so what survives upstream decides which are available.
- Metrics inherit the limits of the pipeline underneath them. A number the pipeline cannot support does not become reliable on a dashboard.
Where CRM data comes from, and the six stages that follow
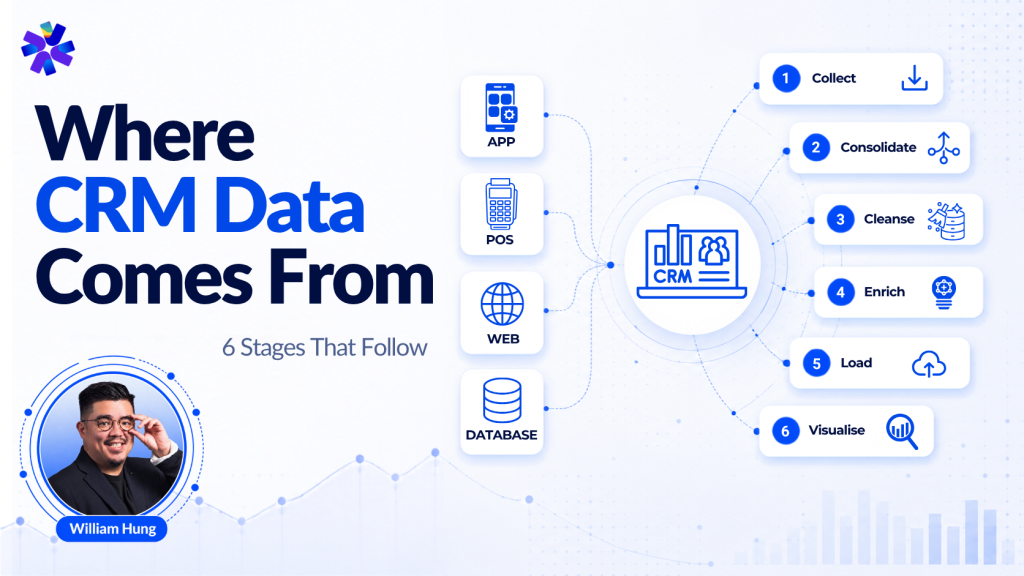
A loyalty record starts as an event somewhere in the estate, and each stage can only narrow what the one before it produced.
Walk me through what happens to a single transaction.
“It gets collected from wherever it happens. POS, the loyalty database, the customer service platform, the booking system, campaign responses. Then it gets consolidated, and the important word there is member. We are trying to understand member behaviour, not overall behaviour. If the analysis is not member-specific, it can describe overall store performance, but not individual customer behaviour.
Then cleansing, enrichment, loading into the analytics database, and visualisation. People treat the last stage as the project and the first three as plumbing, and it is the other way round.”
Stage | What it does | Risk when handled poorly |
|---|---|---|
Collect
|
Pulls records from POS, CRM, service platforms, booking systems and campaigns
|
Late sources arrive with their own rules and are never reconciled
|
Consolidate
|
Connects activity to the member wherever identification is available
|
Analysis stays at store level and cannot support anything member-specific
|
Cleanse
|
Interprets adjustments, returns and system-generated entries correctly
|
Useful behavioural detail is removed alongside the noise
|
Enrich
|
Adds attributes that make the record more useful for analysis
|
Tags enter the record with no recorded source or definition
|
Load
|
Writes prepared data into an analytics database
|
Reporting becomes slow, fragmented or dependent on repeated extracts
|
Visualise
|
Turns stored records into readable output
|
Every team builds its own extract and one question returns several answers
|
Consolidation is also where a single customer view is either built or quietly deferred. Records that arrive still tied to a channel account rather than a person will not resolve later without rework.
Customer Data Quality: What cleaning removes, and what it should keep
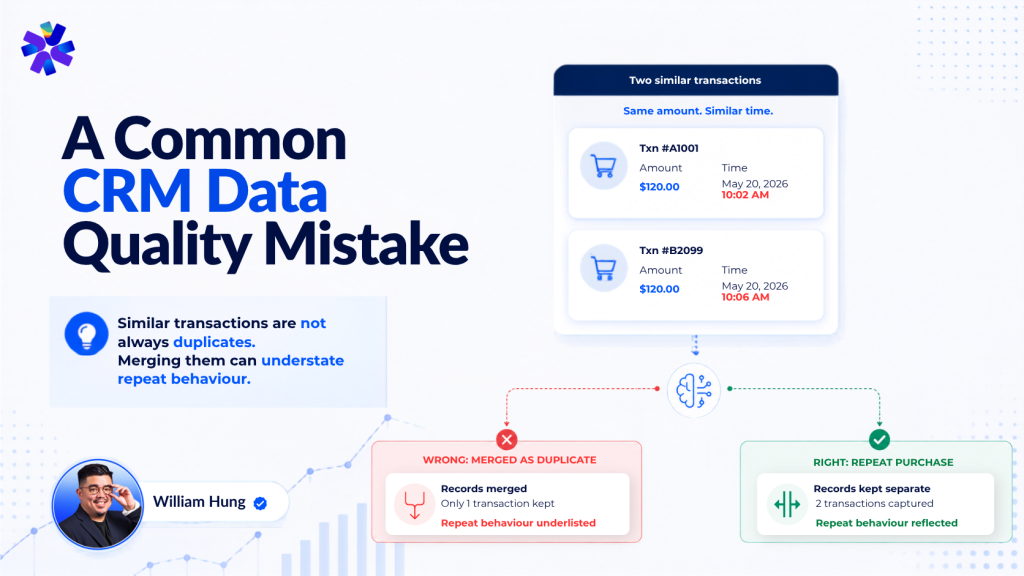
Customer data quality work is usually described as removing what is wrong. The harder judgement is deciding what to keep.
What does cleaning get wrong?
“The quality has to be good or the results are not accurate, so you remove what is irrelevant. But POS auto adjustment gives you everything and people over-clean. Returns come through as negative entries against a purchase, and they have to be read as corrections rather than counted as ordinary transactions. System-generated lines for the same item can get treated as separate purchases, which distorts the behaviour you think you are seeing. An A/B split test arrives as one campaign, and if the cells are not separated you cannot read the result afterwards.
The other one is category detail. If the backend categories are too broad you see that he buys jackets. You do not see that he does not like jackets in general, he likes Gore-Tex. That is a different customer and a different offer.
And some of it is not a cleaning problem at all. Member details differ by source, and addresses are wrong because of how they were typed or never localised. That is a capture failure. Cleaning is only where people notice it.”
Rule | Mechanism | What breaks without it |
|---|---|---|
Preserve correction history
|
Keep enough information to distinguish the original event from its later adjustment
|
The same report returns two answers on two run dates
|
Stable transaction identifier
|
An identifier that stays the same if a transaction is replayed or reprocessed
|
Replayed transactions arrive as new ones and member frequency rises after a network incident
|
A/B cells recorded at design time
|
Separate cell identifiers rather than one campaign ID
|
The split becomes unreadable once the campaign has run
|
A common customer data quality mistake is deduplicating records based only on amount and timestamp rather than a stable identifier. Similar transactions are not always duplicates, and merging them can understate repeat behaviour.
How customer data moves into a marketing data warehouse
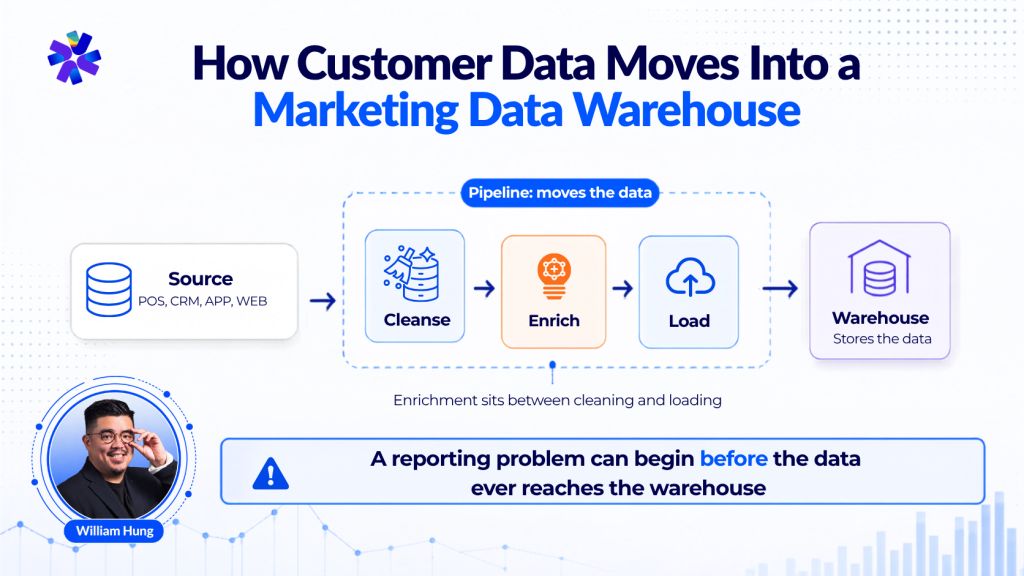
A customer data pipeline moves customer data between systems. A marketing data warehouse stores it in a form built for historical analysis. A reporting problem can therefore begin before the data ever reaches the warehouse.
Why does that distinction matter in practice?
“Because people buy one and expect the other. Somebody buys a warehouse and expects it to collect data, so it sits half empty because nobody built the pipelines feeding it. Or somebody pipes everything into an operational database and calls it a warehouse, and then the reporting and the running of the business are competing for the same system.
Movement and storage are two different jobs. Both have to exist and somebody has to own each of them.”
Loyalty data arrives on different clocks, so most groups run more than one movement pattern.
Movement | What it carries | Example |
|---|---|---|
Batch
| Files on a schedule
| Nightly POS transaction files
|
Event or near real time
| Individual events shortly after they occur
| App activity, stamp and point accrual, triggered messages
|
Outbound activation
|
Prepared segments and attributes sent back out
|
A warehouse audience pushed to campaign and service systems
|
The implementation may use ETL, ELT, change data capture or reverse ETL patterns depending on the systems involved. Whichever is chosen, check that member attribute changes are stored as changes. If only the current value is kept, nothing can reconstruct a member’s profile as it stood on the day a campaign ran.
Enrichment sits between cleaning and loading, and the discipline there is narrower than it looks.
What belongs in enrichment?
“Attributes that make the record more useful for analysis. Purchase frequency, category affinity, tenure, channel preference.
The rule is that every tag needs a source and a definition recorded with it. Where an attribute is inferred rather than observed, that has to be written down, because a tag nobody can trace cannot be reviewed, corrected or explained to the customer it describes.”
New World Group‘s build separated the two. A custom marketing data warehouse consolidated portal data and offline purchases, a data API gave consistent access to those sources, and a single customer view was assembled before segmented campaigns ran. The API step is the one most often skipped, and skipping it produces a warehouse only its builders can query.
How customer segmentation uses what survived
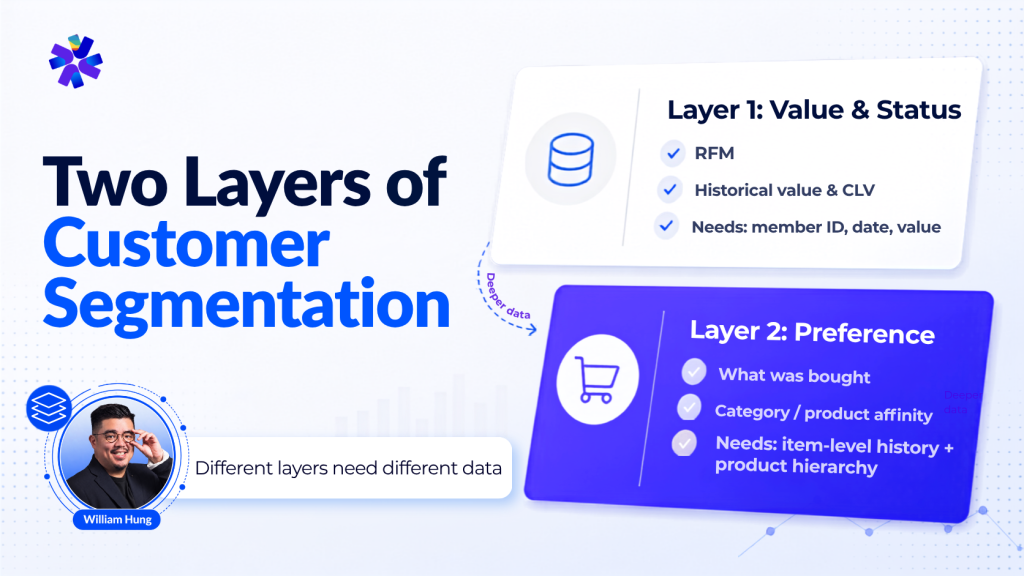
Customer segmentation is where the pipeline produces something a marketing team can act on, and it is the first point at which anything discarded upstream becomes visible.
How does the segmentation work?
“Two layers. The first is scoring. RFM gives you recency, frequency and monetary behaviour, and a CLV score tells you roughly what somebody is worth. Those scores become standard tags on the member record that describe consumption status.
Preference segmentation is the second layer and it needs more. It reads what was bought, at what price, and when and where, to work out what somebody actually likes. With a hundred thousand items and a member buying five, the value is in widening the basket, not selling the same thing again.”
Value covers two measures: historical spend and expected future value. For first-layer segmentation, either must be calculated at member level, because a program average cannot distinguish one member from another.
The methods are not interchangeable, because each needs a different history and a different level of detail.
Approach | What it tells you | Data it depends on |
|---|---|---|
RFM
| Recency, frequency and monetary behaviour
| Member ID, transaction date, transaction value
|
Historical value and CLV
| What a member has actually spent to date
| Customer-level transaction history
|
Customer lifetime value
| Expected future value at member level | Customer-level history plus the inputs required by the model
|
Preference segmentation
| Which categories, products, price points or occasions a customer favours
| Item-level history, purchase context, and a product hierarchy detailed enough to be useful
|
RFM and basic historical value work survive an integration that only sends transaction headers. Preference segmentation does not, because category detail removed upstream cannot be recovered by any customer segmentation tool downstream.
What the dashboard can reliably measure
Every reporting metric depends on the quality and consistency of the data behind it. When loyalty numbers disagree, the real issue is often whether those underlying assumptions were met.
Metric | What it needs | How it misleads when that is missing |
|---|---|---|
Member Growth Ratio | Deduplicated member records across channels
| One person registering in three channels appears as growth
|
Customer Churn Ratio
| One governed dormancy definition
| Different definitions produce different churn rates
|
Engagement Duration
| Consistent interaction start/end data across touchpoints
| Missing touchpoints or inconsistent tracking distort the average
|
Customer Lifecycle Stage
| One definition for each lifecycle stage
| The same customer is classified differently across systems
|
Net Promoter Score
| Consistent survey method and representative responses
| Low or biased response coverage can distort the score
|
Member Spending Uplift Ratio
| Consistent member identification across both periods
| A coverage change reads as a behaviour change
|
Member Frequency Uplift Ratio
| A stable transaction identifier
| Replayed transactions inflate visit counts
|
Voucher-Driven Profit
| Redemption, basket value, discount cost and margin
| Redemption value is mistaken for profit
|
Benefit Redemption Ratio
| Benefits issued and redeemed under consistent rules
| Missing or inconsistent records distort the redemption rate
|
Full definitions for each are set out in KlikNGo’s guide to loyalty program KPIs and metrics. But reporting the program is only half of what the journey is for.
What should the reporting actually give the business?
“Two things. The first is how the program you already run is performing. Member value, frequency, campaign response, voucher performance, churn, redemption. Send 10 vouchers and 1 gets used, and you want to see that quickly enough to move to the offers that are pulling traffic.
The second is what to do next. Which segment the member is in, what they are likely to prefer, which complementary item is worth putting in front of them. A report that only tells you what happened leaves the second half on the table.”
Preference segmentation is the second layer and it needs more. It reads what was bought, at what price, and when and where, to work out what somebody actually likes. With a hundred thousand items and a member buying five, the value is in widening the basket, not selling the same thing again.”
That second output closes the loop. It decides the next offer, which produces the next customer interaction, which creates another record entering the same six stages. CRM data management is what sits in between: every dashboard number traces back to a customer event, and each step between them either preserves what the business can learn or narrows it.
Where William would start
- Map what each source actually sends, field by field, before designing anything on top of it.
- Write the cleaning rules down as decisions, naming what is removed and why, rather than leaving them inside a transformation script.
- Separate movement from storage, and confirm somebody owns each.
- Choose the segments and metrics last, after confirming the pipeline supplies what each of them assumes.
For related implementation details, see KlikNGo’s data management services and membership database, or the full CRM and loyalty program services overview.